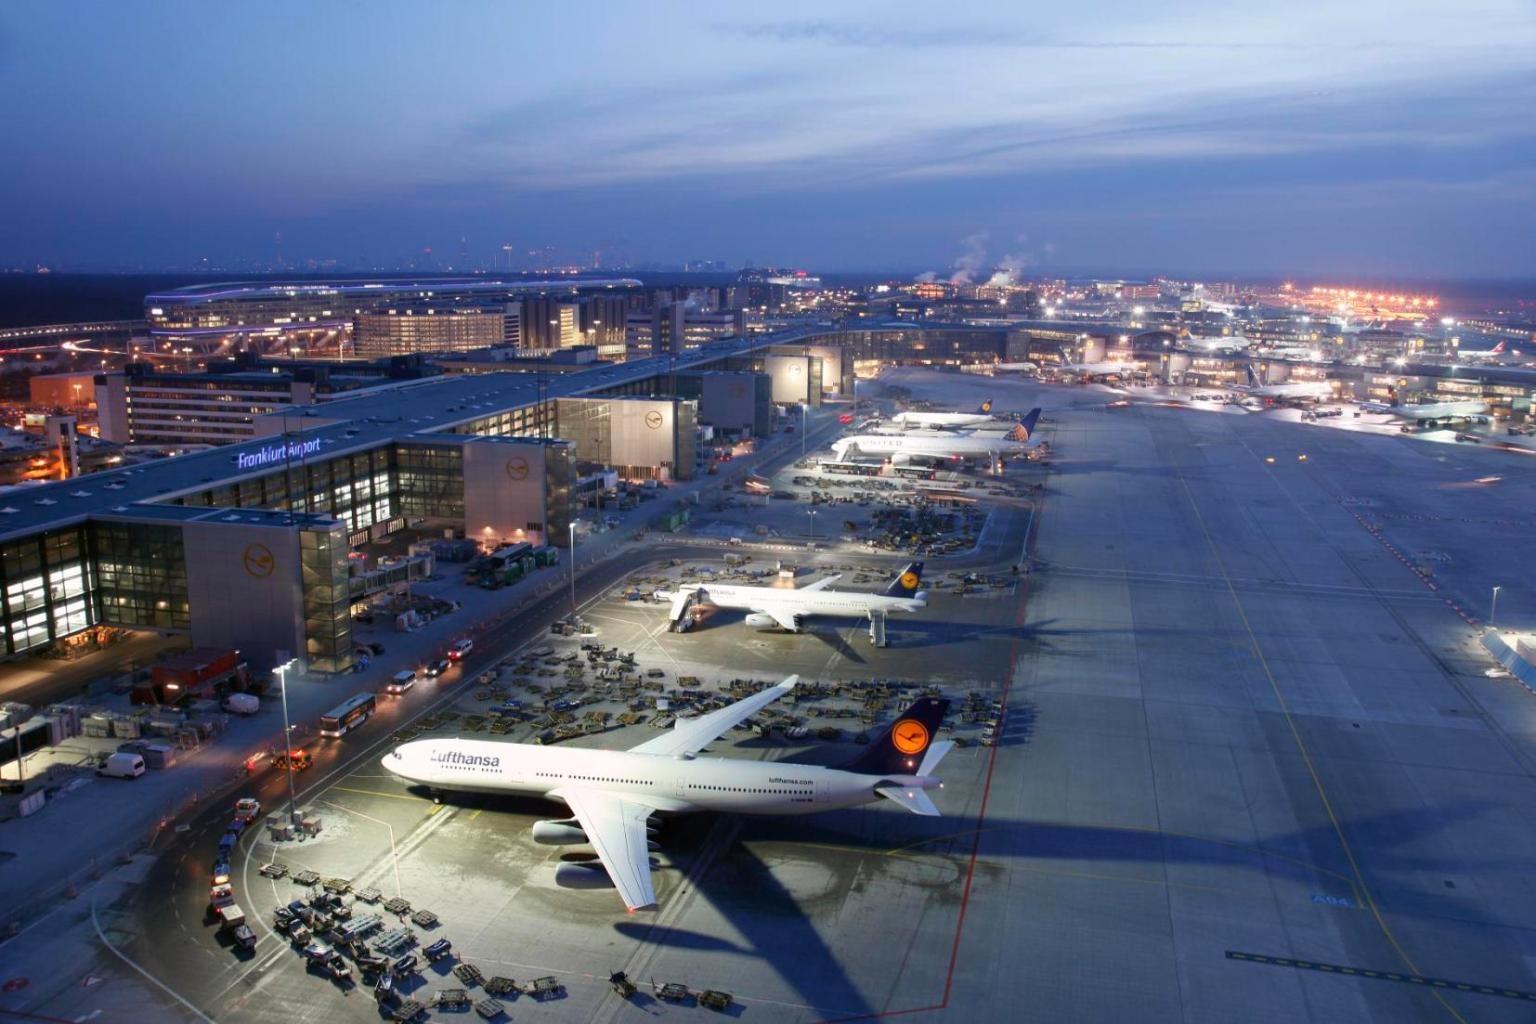


In August 2015, 6.3 million passengers used Frankfurt Airport (FRA), up 3.2 percent year-on-year. On August 2, the Frankfurtinternational hub registered a new historic daily traffic record - with some 217,500 passengers served in a single day. In addition, the number of passengers per flight rose again to 156.3, surpassing the July 2015 figure of 152.4. Correspondingly, aircraft capacity utilization at Frankfurt Airport reached an all-time high of 85.5 percent. The number of aircraft movements increased slightly by 0.2 percent year-on-year to 42,787 takeoffs and landings. Accumulated maximum takeoff weights (MTOWs) grew by 2 percent to more than 2.7 million metric tons. Cargo (airfreight and airmail) dropped by 4.2 percent to 172,055 metric tons, attributable to the weakness in world trade, especially in the Far East.
Among the Fraport AG's Group airports, Slovenia's capital city airport Ljubljana (LJU) again reported dynamic growth of 10.4 percent to about 180,000 passengers in August 2015. Lima Airport (LIM) in Peru, South America, had equally satisfying figures in August 2015, with traffic advancing by 8.5 percent to 1.6 million passengers. Welcoming more than one million passengers, Bulgaria'sTwinstar airports of Varna (VAR) and Burgas (BOJ) together registered a 2.9 percent decline. Turkey's Antalya Airport (AYT) showed a slight decrease of 0.5 percent to 4.5 million passengers. St. Petersburg's Pulkovo Airport (LED) in Russia received 1.7 million passengers, down 3.7 percent year-on-year. Hanover Airport (HAJ) in northern Germany reported positive results for August 2015, with traffic rising by 3.8 percent to about 590,000 passengers. Serving 3.1 million passengers, China's Xi'an Airport (XIY) continued to experience strong traffic growth of 8.9 percent.
Print-quality photos of Fraport AG and Frankfurt Airport are available for free downloading via the photo library located in our Press Center on the Fraport Web site. For TV news and information broadcasting purposes only, we also offer free footage material for downloading.
Fraport Traffic Figures
    August 2015

    Fraport Group
    Airports[1]
                                                            Cargo
                                                         (Freight &
    August 2015           Fraport       Passengers          Mail)          Movements
                        share in %    Month   DELTA %   Month  DELTA %   Month   DELTA %
    Fully-consolidated
    airports
                Frankfurt,
    FRA         Germany     100.00  6,308,634     3.2  169,094   -4.6    42,787    0.2
                Ljubljana,
    LJU         Slovenia    100.00    179,773    10.4      811   13.3     3,311    6.9
                Lima,
    LIM         Peru[2]      70.01  1,594,398     8.5   27,302    2.3    15,150    9.4
                Burgas,
    BOJ         Bulgaria     60.00    724,282    -3.1      648 >100,0     4,796   -2.9
                Varna,
    VAR         Bulgaria     60.00    344,549    -2.6        9  -38.2     2,473   -4.3

    At equity consolidated
    airports[2]
                Antalya,
    AYT         Turkey       51.00  4,495,770    -0.5     n.a.   n.a.    25,329   -0.2
                St.
                Petersburg,
    LED         Russia       35.50  1,688,410    -3.7     n.a.   n.a.    14,030   -7.6
                Hanover,
    HAJ         Germany      30.00    589,699     3.8    1,170   30.6     7.322    2.9
                Xi'an,
    XIY         China        24.50  3,126,739     8.9   19,090   25.0    24,632    5.1

    Fraport Group
    Airports[1]
                                                            Cargo
    Year to Date (YTD)                                    (Freight &
    2015                 Fraport       Passengers           Mail)            Movements
                       share in %      YTD  DELTA %     YTD     DELTA %     YTD   DELTA %
    Fully-consolidated
    airports
                Frankfurt,
    FRA         Germany     100.00 41,476,597     4.3  1,365,049   -2.4   316,079    0.5
                Ljubljana,
    LJU         Slovenia    100.00    978,070    10.9      6,479    0.7    22,241    2.7
                Lima,
    LIM         Peru[2]      70.01 11,160,489     8.9    182,689   -0.6   108,170    6.2
                Burgas,
    BOJ         Bulgaria     60.00  1,963,712    -8.5      6,863 >100,0    14,459   -7.2
                Varna,
    VAR         Bulgaria     60.00  1,082,037    -1.9         64   41.0     8,905   -3.8

    At equity consolidated
    airports[2]
                Antalya,
    AYT         Turkey       51.00 19,323,592    -2.0       n.a.   n.a.   118,826   -2.7
                St.
                Petersburg,
    LED         Russia       35.00  9,455,877    -4.2       n.a.   n.a.    95,196   -3.8
                Hanover,
    HAJ         Germany      30.00  3,610,583     5.3     11,285   20.2  50.485.0   -1.5
                Xi'an,
    XIY         China        24.50 21,876,604    13.6    131,836   13.9   176,649    8.8

    Frankfurt Airport[3]
                                              DELTA         YTD      DELTA
    August 2015                         Month   %          2015        %

    Passengers                      6,308,759   3.2     41,480,679    4.3

    Cargo (freight & mail)            172,055  -4.2      1,388,338   -2.2
    Aircraft movements                 42,787   0.2        316,079    0.5
    MTOW (in metric
    tons)[4]                        2,721,552   2.0     19,870,863    3.2
    PAX/PAX-flight[5]                   156.3   2.7          140.6    4.0
    Seat load factor (%)                 85.5                 78.2
    Punctuality rate (%)                 80.8                 79.8

                                              Month     PAX
    Frankfurt Airport                         DELTA   share    YTD
    Regional Split            PAX share month     %     YTD DELTA%
    Continental                         61.6%   3.2   62.2%    4.4
    Germany                              9.5%   4.3   11.1%    6.1
    Europe (without
    Germany)                            52.1%   3.1   51.1%    4.0
    Western Europe                      43.2%   3.1   42.4%    3.9
    Eastern Europe                       8.9%   2.6    8.6%    4.6
    Intercontinental                    38.4%   3.2   37.8%    4.3
    Africa                               4.1%   0.3    4.0%    3.8
    Middle East                          5.6%   4.6    5.4%    7.2
    North America                       14.6%   3.1   13.5%    2.2
    Central & South
    America                              2.9%  -0.3    3.5%    1.5
    Far East                            11.3%   4.6   11.4%    6.7
    Australia                            0.0%   0.0    0.0%    0.0
[1] According to ACI-definition:
Passengers: commercial traffic only (arr+dep+transit counted once)
Cargo: commercial and non-commercial traffic (arr+dep excluding transit, in metric tons)
Movements: commerical and non-commercial traffic (arr+dep)
[2] Preliminary figures
[3] Passengers: commercial and non-commercial traffic (arr+dep+transit counted once incl. General Aviation)
Cargo: commercial and non-commercial traffic (arr+dep+transit counted once, in metric tons)
Movements: commerical and non-commercial traffic (arr+dep)
[4] Inbound traffic only
[5] Scheduled and charter traffic
AeronautX, part of the AX Aero Group, has announced the launch of a new business aviation pilot training centre in Amsterdam, scheduled to open in the first quarter of 2027. Created by business a...
At Marrakech Airshow 2026, Bell Textron Inc. announced AVIARAIL as its new authorized independent sales representative for Morocco, reinforcing its commercial footprint and enhancing engagement with c...
Bombardier will return to the 2026 NBAA Business Aviation Convention & Exhibition with a showcase that highlights the company's flagship aircraft, award-winning customer support network and di...
Marking a significant industry milestone, Garmin has delivered its 1,000th G1000 integrated flight deck retrofit for a King Air aircraft. The program has helped redefine cockpit modernizatio...